-2.jpg) By Thomas HornigoldMar 14 2018
By Thomas HornigoldMar 14 2018Earlier this month, the results of a seventeen-year survey on CO2 emissions around Salt Lake City in Utah were published. With the first of the sensors placed in February 2001, this represents the only multi-site urban CO2 sensor network that has been measuring concentrations of the greenhouse gas for over a decade; giving the scientists sufficient time to examine the effects of sprawling urbanization. The only comparable measurements are in Heidelberg, Germany and Pasadena, California - these sites have measurements that stretch back for a decade, but rely on only one sensor and therefore cannot capture the urban variability.
John Lin, who co-authored the study, is proud of the work of his University: “We know more about CO2 in the Salt Lake Valley than any other urban area.”
 Image credit: The University of Utah
Monitoring CO2 emissions from cities will prove crucial in the efforts to fulfill the goals of the Paris Agreement. Calculating global carbon emissions is difficult enough, and the question of attribution is an important one: without it, it’s impossible to account for the emissions and allocate funding where it’s needed.
This is especially important in the US in the light of the “We’re Still In” movement, where local governments have pledged to take on fulfilling the Paris climate goals. Salt Lake City’s pledge is ambitious; they hope to reduce CO2 emissions by 80% by 2040. This may sound radical, but given that many climate change projections require global CO2 emissions to fall to almost zero by mid-century to fulfill the Paris Agreement, it’s important that rich countries and cities lead the way. If an international system of monitoring and measurement is to succeed, it will rely on technology pioneered in studies like this one.
That first sensor, placed atop the eight-story William Browning Building on the University of Utah campus, was soon joined by sensors in the Sugarhouse (placed in 2005), Murray (2005) and Rose Park (2009) areas, covering a range of urban and suburban areas around Salt Lake City. Background CO2 levels are measured at Hidden Peak, at the top of the Snowbird ski resort.
The study, published in the Proceedings of the Natural Academy of Sciences, has interesting consequences for urban planners. It’s considered that cities will be the key to fighting climate change and reducing CO2 emissions; more than 60% of the world’s population will live in cities by 2030. It was determined that CO2 emissions should rise with the population of a city; more people means more cars, more consumption, more electricity use, and so on. But this monitoring programme suggests that there is a non-linear relationship; CO2 emissions rise more when populations sprawl into the suburbs than if the same rate of population growth occurs in the city center.
The general thought is that more compact cities on a per capita basis emits less carbon. Some of these cities also have these expanding fringes. These places are less ‘green,’ so to speak. That expanding frontier is moving.
John Lin, Co-Author
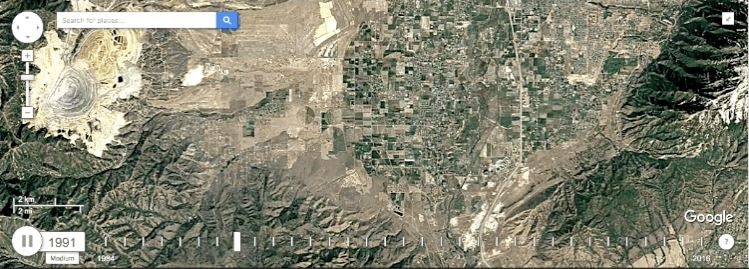
The key location was the placement of a sensor in the South Jordan area back in 2004; in the decade since the land use in this region has changed significantly. Although it used to be green belt and largely not developed, it’s now part of Salt Lake City suburbia. “That part of the valley is a really important part of the story,” Lin says.
You’re going from a land surface type where there are no people around, and you have suburban expansion into this undeveloped land. It’s changing the CO2 emission framework quite a bit.
,Logan Mitchell, Co-Author
It turns out that the growth in CO2 emissions due to the increased population of the urban center is small compared to that which occurs due to the suburban sprawl. In some ways, this makes a lot of sense; those who live in the city center are likely to make more use of public transport and have shorter commutes if they do drive. This means that it’s important to change the definition of a city’s emissions to include the built-up area of suburbia around it.
“Salt Lake City is one entity in the valley, but it’s not the only one,” Mitchell says. “If you reduce emissions by 80 percent and everyone moves out further from work and commutes in, it’s not actually solving the problem.”
The next stage will be to compare the Salt Lake City data to that which exists for other cities and to see if the team can find a measurable correlation between CO2 pollution and air quality data – providing further motivation and information to those who want a cleaner urban area.
Lin and Mitchell are now leading a project called CO2-USA (CO2-Urban Synthesis &Analysis network) which will link data from urban areas across the USA, and see how robust this relationship is. Some might have three to five years of data,” Lin says. “We’re hoping to join forces and to compare and contrast cities.”
This approach should yield fascinating and important information for policymakers and urban planners as we head into what will hopefully be a greener world.
Disclaimer: The views expressed here are those of the author expressed in their private capacity and do not necessarily represent the views of AZoM.com Limited T/A AZoNetwork the owner and operator of this website. This disclaimer forms part of the Terms and conditions of use of this website.