Mar 24 2015
When an earthquake hits, the faster first responders can get to an impacted area, the more likely infrastructure--and lives--can be saved.
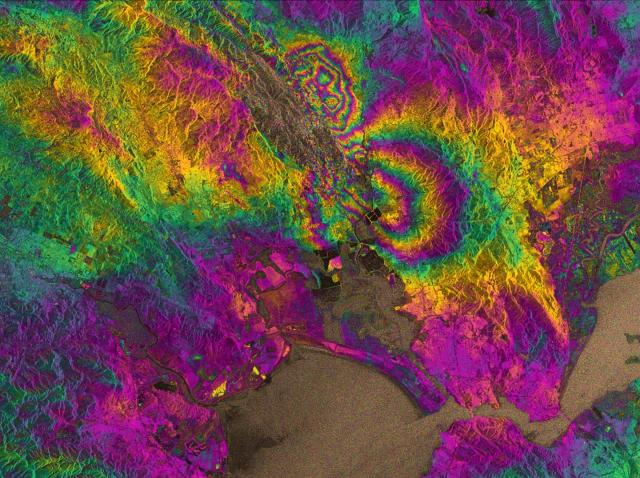
 Satellite radar image of the magnitude 6.0 South Napa earthquake. The "fringe" rainbow pattern appears where the earthquake deformed the ground's surface, with one full cycle of the color spectrum (magenta to magenta) showing 3 centimeters of change. Satellite data like this can now be used to give researchers an understanding of an earthquake and its impacts within days. Credit: Photo courtesy of the European Space Agency.
New research from the University of Iowa, along with the United States Geological Survey (USGS), shows that GPS and satellite data can be used in a real-time, coordinated effort to fully characterize a fault line within 24 hours of an earthquake, ensuring that aid is delivered faster and more accurately than ever before.
Earth and Environmental Sciences assistant professor William Barnhart used GPS and satellite measurements from the magnitude 6.0 South Napa, California earthquake on August 24, 2014, to create a three-dimensional map of how the ground surface moved in response to the earthquake. The map was made without using traditional rapid response instruments, such as seismometers, which may not afford the same level of detail for similar events around the globe.
"By having the 3D knowledge of the earthquake itself, we can make predictions of the ground shaking, without instruments to record that ground shaking, and then can make estimates of what the human and infrastructure impacts will be-- in terms of both fatalities and dollars," Barnhart says.
The study, "Geodetic Constraints on the 2014 M 6.0 South Napa Earthquake" published in the March/April edition of Seismological Research Letters, is the first USGS example showing that GPS and satellite readings can be used as a tool to shorten earthquake response times.
And while information about an earthquake's impact might be immediately known in an area such as southern California, Barnhart says the technique will be most useful in the developing world. The catastrophic magnitude 7.0 earthquake that hit Haiti in 2010 is the perfect example for the usefulness of this kind of tool, Barnhart says. The earthquake struck right under the capital city of Port Au Prince, killing up to 316,000 people, depending on estimates, and costing billions of dollars in aid.
"On an international scale, it dramatically reduces the time between when an earthquake happens, when buildings start to fall down, and when aid starts to show up," Barnhart says.
To accurately map the South Napa earthquake for this study, Barnhart and a team of researchers created a complex comparison scenario.
They first used GPS and satellite readings to measure the very small- millimeter-to-centimeter-sized-displacements of the ground's surface that were caused by the earthquake. They fed those measurements into a mathematical equation that inverts the data and relates how much the ground moved to the degree of slip on the fault plane. Slip describes the amount, timing, and distribution of fault plane movement during an earthquake.
This allowed the group to determine the location, orientation, and dimensions of the entire fault without setting foot on the ground near the earthquake. The mathematical inversion gave the researchers predictions of how much the ground might be displaced, and they compared those results to their initial estimations, bit by bit, until their predictions and observations match. The resulting model is a 3D map of fault slip beneath the Earth's surface. The entire procedure takes only a few minutes to complete.
Nationally, there is a push to create an earthquake early-warning system, which is already being tested internally by the USGS in coordination with the University of California, Berkeley; the California Institute of Technology; and the University of Washington. While only researchers, first responders, and other officials received the early warning message, it did work in testing for the Bay Area during the Napa earthquake. Individuals in Berkeley received nearly 10 seconds of advanced warning before the ground began shaking. The information contained in Barnhart's study could be used to create further tools for predicting the economic and human tolls of earthquakes.
"That's why this is so important. It really was the chance to test all these tools that have been put into place," Barnhart says. "It happened in a perfect place, because now we're much more equipped for a bigger earthquake."