As the population grows and road systems expand, traffic congestion has developed into a substantial global problem. There is a lack of up-to-date traffic data because it is labor-intensive and expensive to collect, and traffic congestion has become worse as a result, as traffic officials do not possess good insight into the state of their traffic.

ImageCredit: Shutterstock/Michael Gancharuk
Collecting traffic data manually is laborious, and can also only be carried out on specific days and hours. Additionally, installing and maintaining traffic sensors on roads is not scalable or cost-effective. The gold standard for traffic measures such as counts and classifications still lies with cameras or radars, but there are other alternatives available for use in collecting data on speed and travel time.
Crowdsourced Traffic Data
Crowdsourced traffic data, also known as probe data or floating car data, is a novel way of collecting data on traffic congestion. This particular source is based on timestamped location and speed data taken from moving vehicles, with location data being collected from onboard GPS systems in cars or from mobile applications. Traffic data could be available for an increased number of roads and locations using a crowdsourced method, which makes installing physical sensors unnecessary.
Data Accuracy
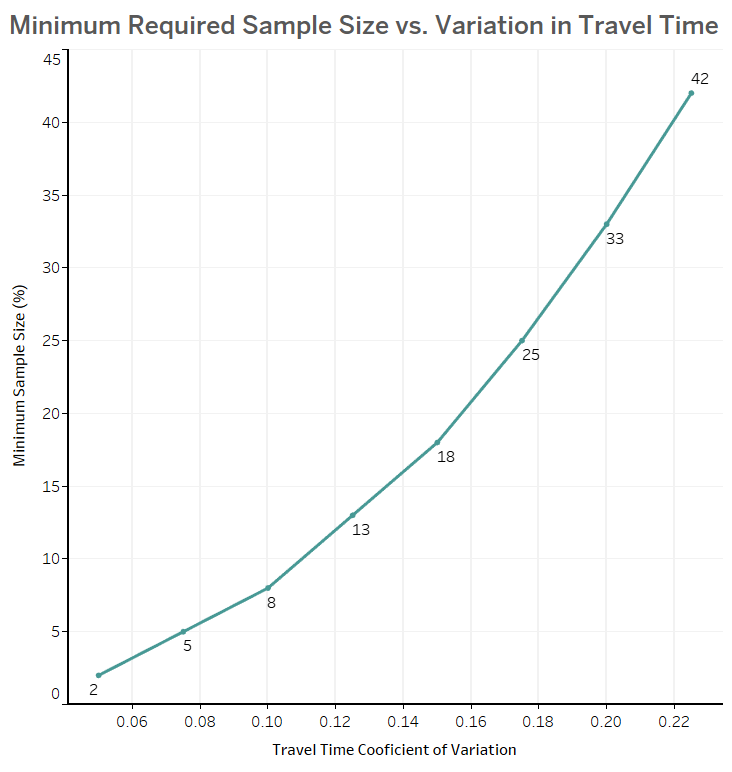
The accuracy of crowdsourced data is highly dependent on the sample size available, for instance, the number of floating cars traveling on the segment of road that are sharing their location data with the crowdsourced supplier. To gather reliable data, the minimum required sample size depends on the expected variation in traffic data, meaning that the more variation in data there is, the larger the sample size needs to be.
For example, travel time for arterial roads is generally more variable because of traffic signals when compared to freeways and highways. Figure 1 shows the minimum required sample size versus variation in travel time data. Based on the sample size, some crowdsourced traffic data suppliers provide a confidence index with the data for each reporting interval.

Figure 1. Minimum sample size required vs. variation in traffic data. Image Credit: SMATS Traffic Solutions Inc.
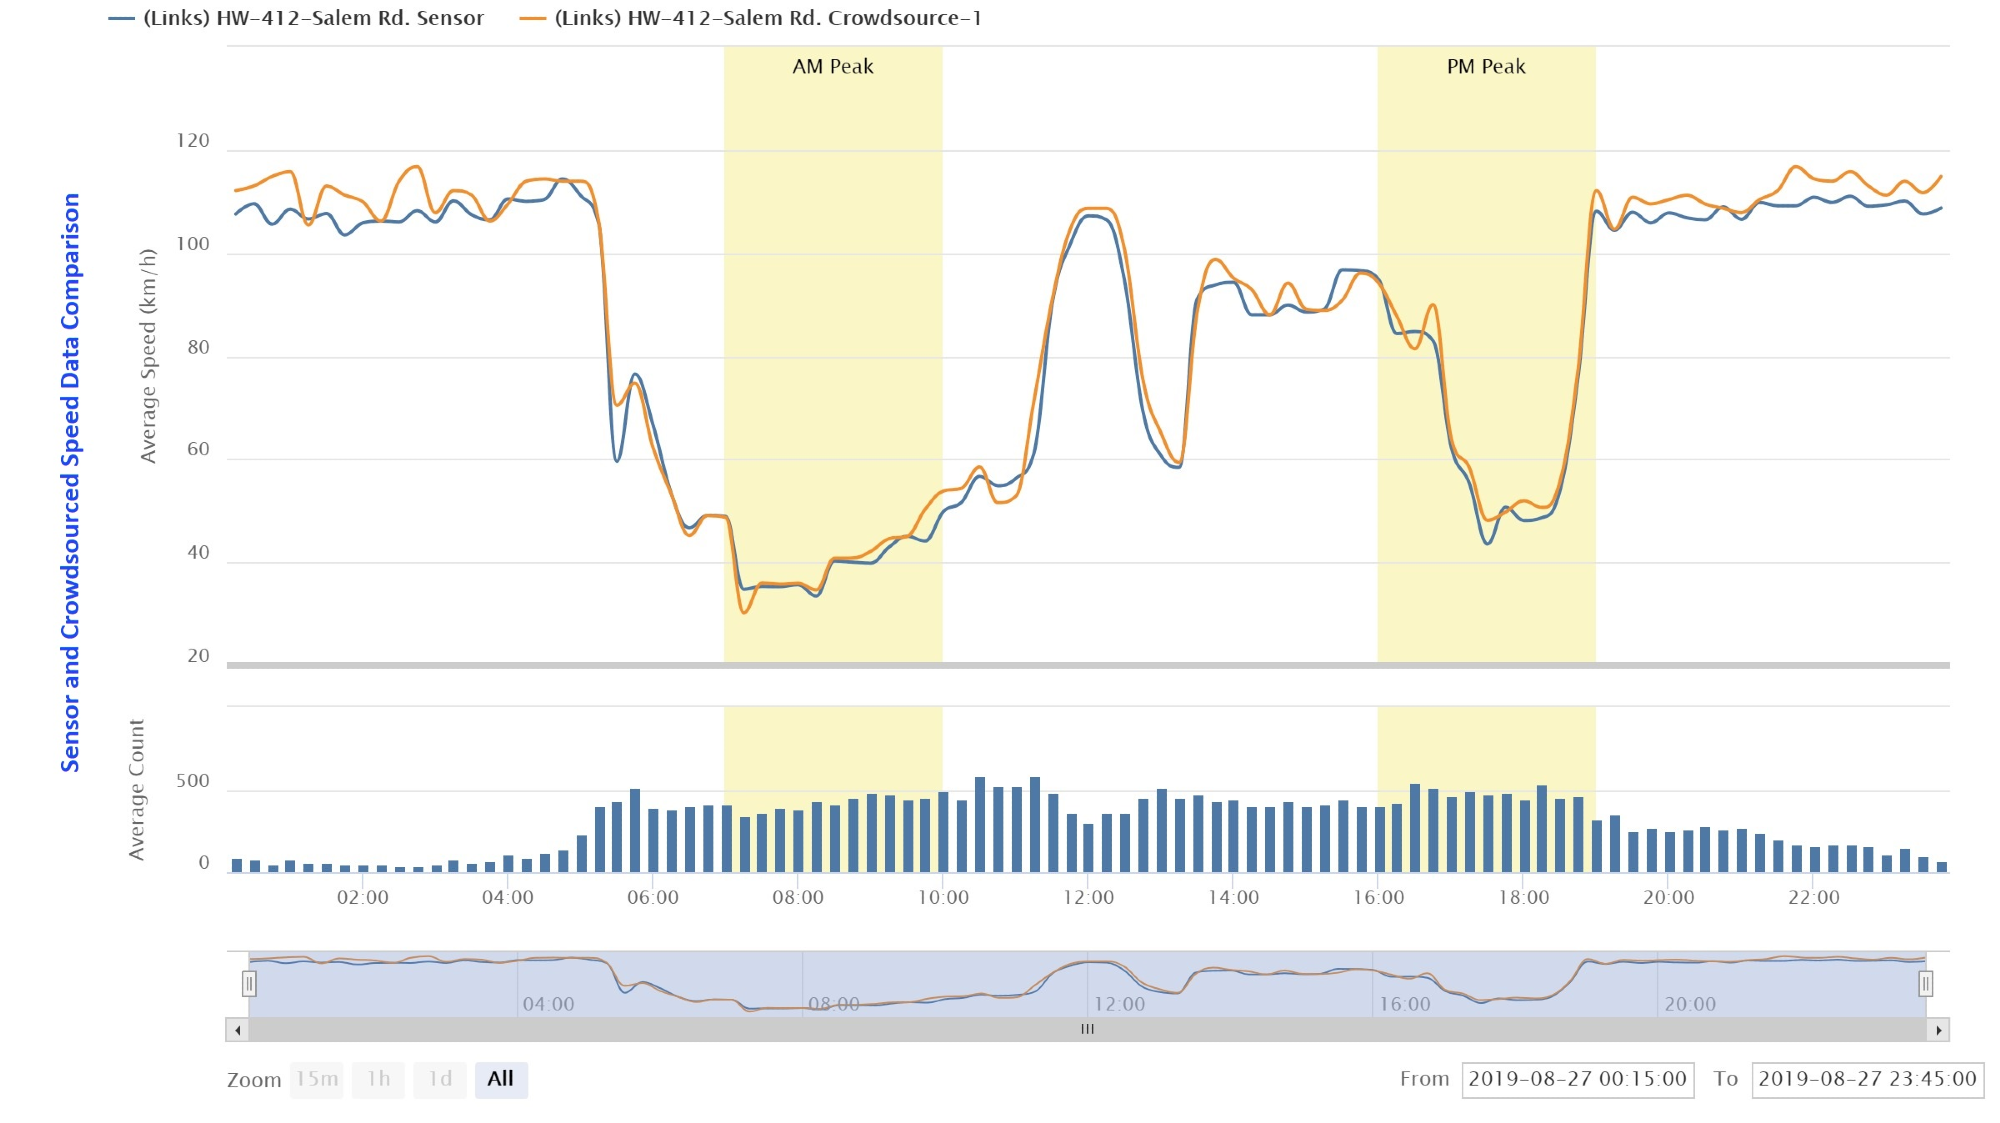
Figure 2 shows a comparison of the speed data from a road segment, sourced from crowdsourced data vs. WiFi and Bluetooth sensors for a major highway in Canada. It shows a close match between the two data sources.

Figure 2. Segment speed sourced from probe vehicle data vs. WiFi and Bluetooth sensors. Image Credit: SMATS Traffic Solutions Inc.
Data Aggregation
The floating car data is categorized as a big data. Every floating car offers high-resolution location data every few seconds. Because of this, time and space data aggregation has to be employed to manage the space needed to store it. To do this, road segments are developed for which multiple floating car data are aggregated to provide average speed and travel time data for any given time. Generally, these segments are pre-defined with their length chosen based on the samples available and select aggregation level. However, this can prove to be a limitation in instances where traffic data is needed for a road segment that has different origin and destination coordinates from the pre-defined segments put in place by the data supplier.
Historical Data
Depending on the data provider, historical data can be made available for a couple of years prior for specific regions. However, although historical data does offer valuable information on roadway performance, the aggregation applied to the data often holds back more of the detailed analysis needed for various use cases.
The SMATS Traffic Solutions traffic data analytics application, iNodeTM, has achieved flexible integration with crowdsourced traffic data providers to deliver traffic data collection on-demand in a cost-effective manner for a variety of use cases.
These use cases have ranged from traffic operation that deals with live traffic data, to transportation planners and engineers who concentrate on different traffic studies for before and after periods. iNodeTM has been applied effectively to numerous use cases, which include:
- Bottleneck detection
- Traffic signal re-timing
- Lane re-allocation
- Road closure and detours
- On-street parking projects
The City of St. St. Petersburg, a Florida Success Story
Under the Complete Streets Implementation Plan, the City of St. Petersburg has developed a range of performance metrics that measure the transportation system’s performance in agreement with their Complete Streets policy. These additional measures aid in the implementation of alterations to the city transportation systems, which are more balanced among different roadway user types.
However, for the City of St. Petersburg, gathering and analyzing the required data to make decisions relating to this process was a challenge, as the department’s staffing level had not increased along with the workload linked with the Complete Streets data collection project.
It was necessary for staff to drive the corridors themselves to investigate travel time and travel time reliability. This process generally required two members of staff, with one member of staff driving safely while the other member of staff recorded drive times. Further members of staff then reviewed and analyzed the data collected on the drive. These studies were a staff-intensive process, and were also vulnerable to human error and the potential for bias.
The City of St. Petersburg officials utilized the iNodeTM application to monitor the traffic flow and levels of congestion on various highways and roads across the city. With the iNodeTM platform, the city has since created more than 60 segments that study travel time and travel time reliability along particular corridors.
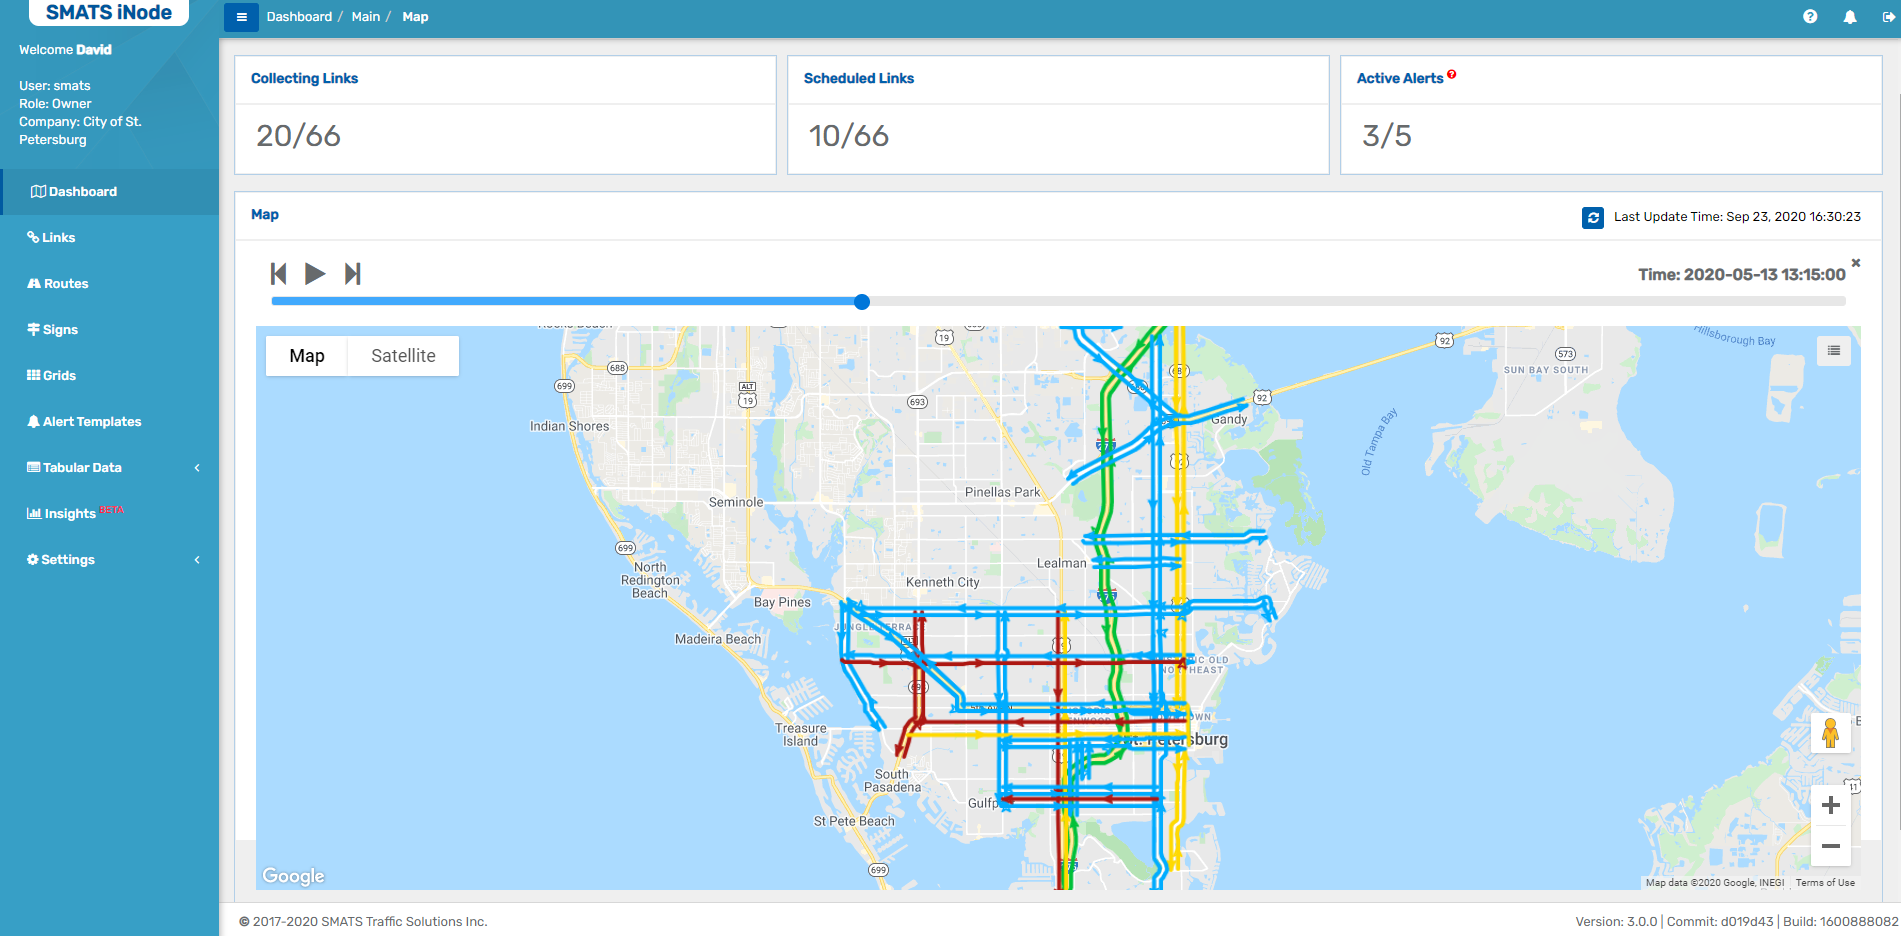
The dashboard map on iNodeTM, shown below, allows the City to benefit from an overall view of their chosen segments and their locations, and to monitor and measure the level of congestion for different links. The visualization and comparison features that iNodeTM offers have simplified travel time studies for the City of St. Petersburg.

Figure 3. SMATS iNode Map View-City of St. Petersburg Data Collection Segments. Image Credit: SMATS Traffic Solutions Inc.

This information has been sourced, reviewed and adapted from materials provided by SMATS Traffic Solutions Inc.
For more information on this source, please visit SMATS Traffic Solutions Inc.